Understanding Standard Deviation: Definition, Formulas, Steps, and Examples
A measure of the degree of variability or dispersion in a set of data is provided by the standard deviation. In practical terms, a low standard deviation may indicate that the data is reasonably consistent or predictable, whereas a high standard deviation shows those data whose fall from the mean of data points.

Understanding and calculating standard deviation is essential in various fields, including statistics, finance, and science, as it helps to assess and compare the reliability and variability of data sets.
In this the given article we will explore the standard deviation. Also, we will explore the definition, and formulas of standard deviation, the method used for calculating, and the types of standard deviation, we will explain the detailed example and their solution of standard deviation.
Definition of Standard Deviation
Standard deviation is a concept of measuring of set of data to measure the variation or dispersion in the set of data points. Standard deviation gives the suitable to understand how value spreads or is close to the average of standard value.
Two form is used to indicate the data value low standard deviation and high standard deviation; low standard deviation indicates those data value whose close to the mean value on the other hand high standard deviation indicates those value that spread out of the mean value or range value.
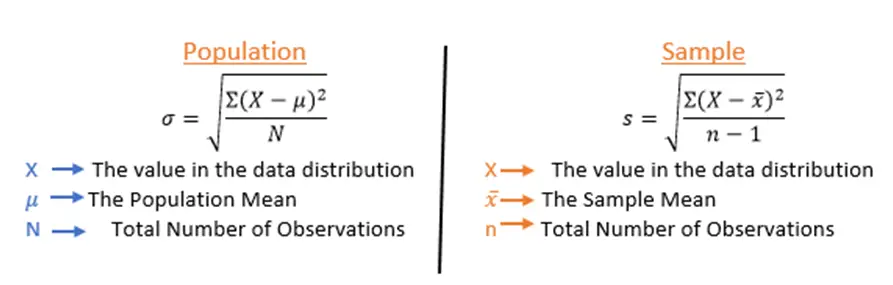
Two types of standard deviation are used one is standard form for the population and the other is standard deviation for the sample. When we want to find the standard deviation of all possible observations of data point’s standard deviation of the population is used.
In the given population, formula xi indicates the individual data points, N represents the total number of data points and μ indicates the population means. When we want to find the standard deviation of any subset of our entire population, we used this type of standard deviation. This formula is different from the formula for population.
Formulas
There are two formulas of standard deviation one used for population and the other used for sample.
Steps of Calculating Standard Deviation
The following steps are used to find the standard deviation.
- Calculate the Average: First, add all data values and divide them total number of values.
- Determine the Differences: After deducting the mean from every data point, square the outcome.
- Calculate the Variance: Find the average of the squared differences.
- Square root taking: After finding the variance value, we take the square root, which gives the value of standard deviation.
How to Find Standard Deviation?
Example 1: For sample standard deviation
Find the population standard deviation of 10, 2, 38, 18, 35, and 23
Solution
Step 1: Evaluate mean.
Mean of sample data = ∑x/n = [10 + 2 + 38 + 18 + 35 + 23]/6
= 126/6
= 21
Step 2: Now find the typical distance of each data point & the mean and square of each deviation
| Data values (xi) | xi – µ | (xi – µ)2 |
| 10 | 10 – 21 = -11 | (-11)2 = 121 |
| 2 | 2 – 21 = -19 | (-19)2 = 361 |
| 38 | 38 – 21 = 17 | (17)2 = 289 |
| 18 | 18 – 21 = 3 | (3)2 = 9 |
| 35 | 35 – 21 = 14 | (14)2 = 196 |
| 23 | 23 – 21= 2 | (2)2 = 4 |
∑ (xi – µ)2 = 121 + 361 + 289 + 9 + 196 + 4
∑ (xi – µ)2 = 980
Step 4: Now divide the sample mean (n-1)
∑ (xi – µ)2/n-1 = 980/6-1
∑ (xi – µ)2/n-1 = 980/5
∑ (xi – µ)2/n-1 = 196
Step 5: Take the square root.
√ [∑ (xi – µ)2/n-1] = √196
√ [∑ (xi – µ)2/n-1] = 14
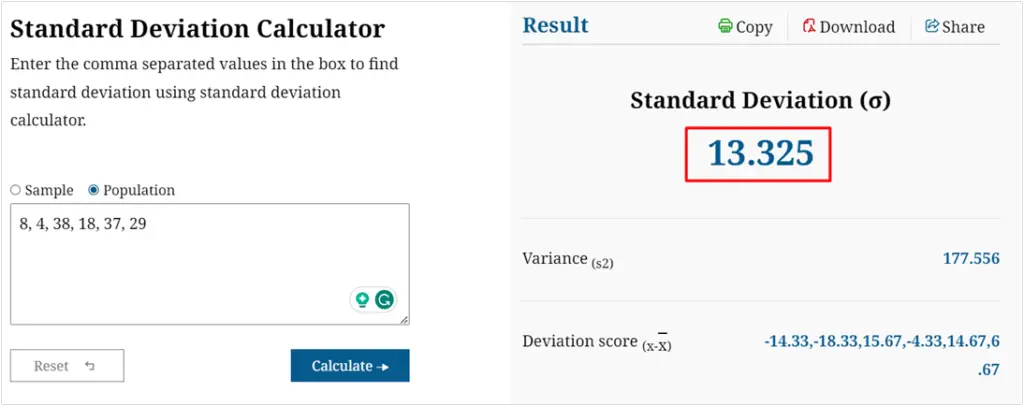
Example 2: For population standard deviation
Find the population standard deviation of 8, 4, 38, 18, 37, and 29
Solution
Step 1: Evaluate the mean
Population mean = ∑ x/n
= [8+ 4+38+ 18 +37 +29]/6
= 134/6
= 22.34
Step 2: Now find the typical distance of each data point & the mean and square of each deviation.
Data values (xi)
xi – µ
(xi – µ)2
8
8 – 22.34 = -14.33
(-14.34)2 = 205.35
4
4 – 22.34 = -18.33
(-18.34 )2 = 335.99
38
38 – 22.34 = 15.67
(15.67)2 = 245.55
18
18 – 22.34 = -4.33
(-4.34)2 = 18.75
37
37 – 22.34 = 14.66
(14.66)2 = 215.21
29
29 –22.34 = 6.66
(7.34)2 = 44.36
Step 3: Add the deviations to find the statistical sum of squares.
∑ (xi – µ)2 = 205.35 + 335.99 + 245.55 + 18.75 + 215.21 + 44.49
∑ (xi – µ)2 = 1065.34
Step 4: Now divide the sum of squares by n.
∑ (xi – µ)2/n = 1065.34/6
∑ (xi – µ)2/n = 177.56
Step 5: Take the square root.
√ [∑ (xi – µ)2/n] = √177.56
√ [∑ (xi – µ)2/n] = 13.325
To find standard deviation according to the above ways, you can also use online tools like Standarddeviationcalculator.io.
Summary
In this given article we have explored the standard deviation. In addition, we have discussed the definition, and formulas of standard deviation, the method used for calculating, and the types of standard deviation, we have explained the detailed example and their solution of standard deviation.
Frequently asked question
Question# 1: Discuss the use of standard deviation.
Answer:
The significance of standard deviation lies in its ability to evaluate the dependability and fluctuation of data. Standard deviation helps for decision making, like science, including and statics, and helps for comparing the help of data.
Question# 2:
What relationship does standard deviation have to variance?
Answer:
Standard deviation and variance are related to each other. The square variance response is the same as the standard deviation. The standard deviation is frequently selected since it is in the same units as the data, even though variance also gives a measure of dispersion.
Question# 3:
How may the standard deviation be applied while making decisions?
Answer:
The standard deviation gives information about the degree of risk or uncertainty attached to a set of data, which aids in decision-making. It can be applied to evaluate the consistency of estimates or forecasts, compare the variability of various data sets, and make well-informed decisions based on data variability.